The piezzometrique graphic of a fluid network, shows how the fluid pressure changes in response to changes in speed (dynamic pressure) , the elevation (hydrostatic head) load gains and losses caused by the bodies through.
The change in the pressure within a fluid volume (described by Bernoulli's formula ) , becomes more understandable when the energies of pressure are shown separately. Figure piezometric, brings up the components of dynamic pressure, static load and gains or losses, at the level of inputs and outputs of each element of the fluid network.
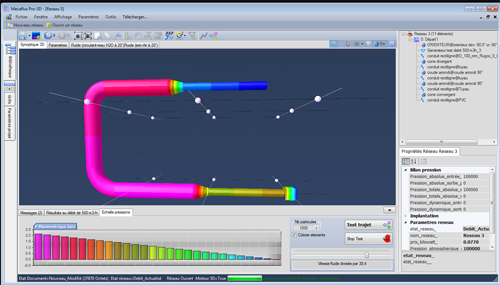
Mecaflux pro 3D edits a representation of each segment of the network as a graph piezometric that can be recorded with its data table. It's easy to check the conditions and causes of the pressure variations throughout the network.
In this Mecaflux Pro 3D softwar escreen shot, pressure gauge is represented by a color code. To better understand the role of dynamic pressure, hydrostatic and gains or losses, a representation of the network as piezometric graphic is required ......
The piezzometriques mecaflux Pro 3D graphics can be configured to include or hide data types to highlight the significant parameters:
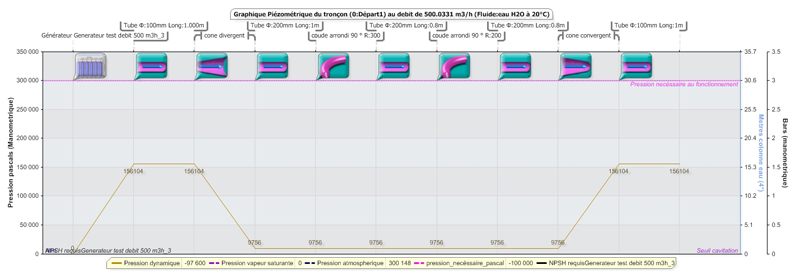
In this graph, piezometric, we see the evolution of the dynamic pressure (orange) of the fluid during its passage through the organs of the network:
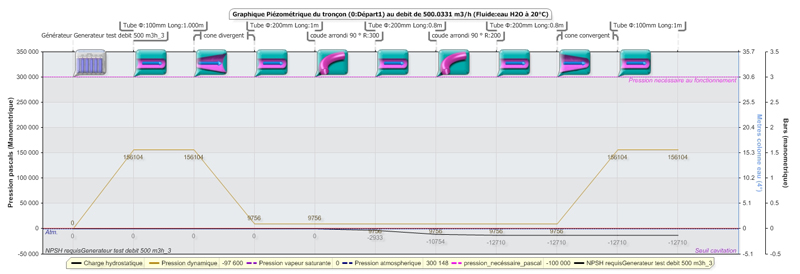
below, we see the evolution of the dynamic pressure (orange) and hydrostatic pressure (black) fluid during its passage through the organs of the network:
below, we see the evolution of the gains and losses of load of the fluid during its passage through the organs of the network:
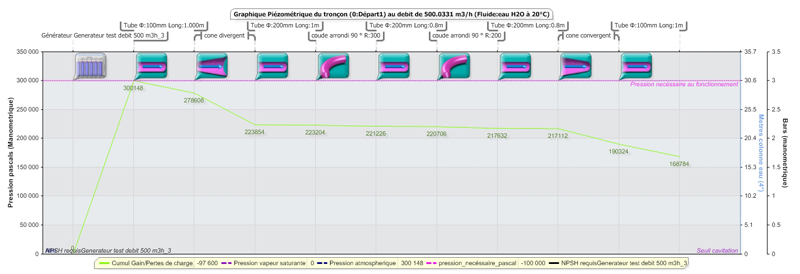
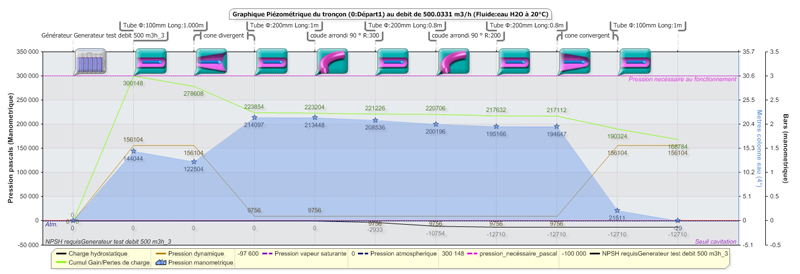
In this piezometric graphic (below) we see the evolution of the manometer pressure and other pressures which it results in its passage through the organs of the network: