
The distribution of fluids, liquids or gases, air or water, are studied in order to provide the desired flow rate with minimum cost of installation, maintenance and operation.
To make the right choice, we must properly size ducts, and organs of the network, taking into account the evolution of the flow. It may be wise to create graphics and save it, to compare and argue the technical choices in groupsto compare and argue the technical choices in groups.
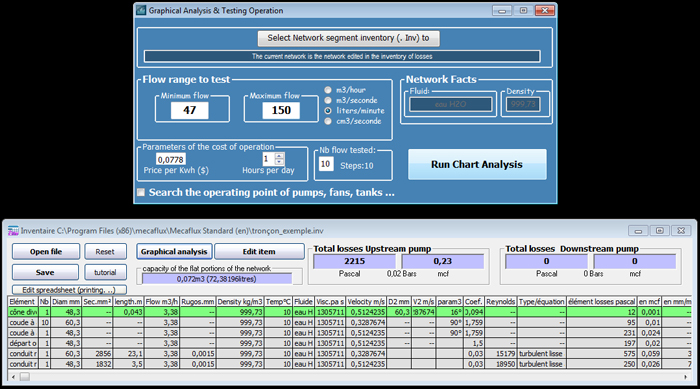
The graphical analysis tool was created for this purpose. it allows you to test your inventory losses under different flow rates.
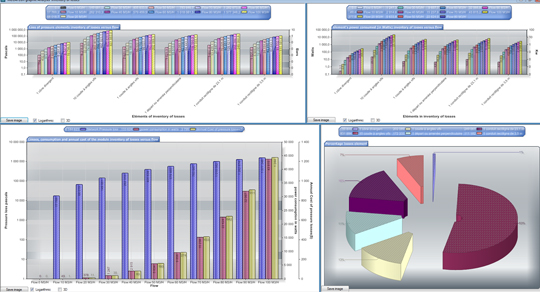
The head loss graphs show:
- the proportions of losses for the network elements,
- Energy consumption
- and the cost of losses.
Whether an element is improperly sized, this will appear with evidence in operating cost or loss of pressure.
This allows to visualize the consequences of choice of equipment, in terms of operating costs, and create simulations of different networks in order to find the best compromise.
We need to know the operating curve of the reservoir (load), and the operating curve of the network.The intersection of the two curves gives the operating point.
Pressure drop curve of the network:
- Calculate the pressure drop at an approximate rate (unimportant because the flow will be reviewed)
of the elements of the segment connected to your tank with inventory losses..and Register your inventory loss.. - Open the graphical analysis (menu tools / graphical analysis) and load your saved segment..
Curve of the tank (allows to know the max):
-
Select "Search for the operating point"
- select "fluid reservoirs"
- Enter the height of liquid
- Enter the outlet diameter
click create tank curve
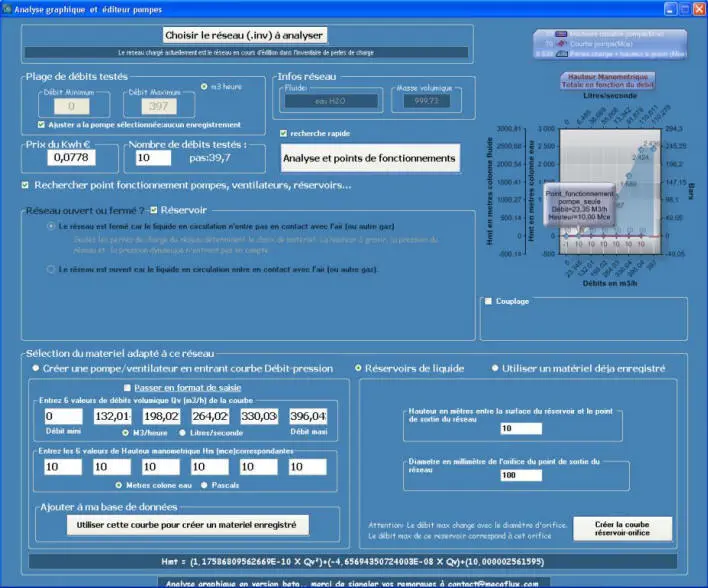
click on "Start graphical analysis"
if it exists, your operating point appears on the graph.
Otherwise this is that the flow range is not compatible, you must resize the orifice diameter.