-
Calcul de la portance et de la traînée de profils. (flux externes) les forces en aérodynamique et hydrodynamique
-
Perte de charge régulière. (flux internes) Les frottements et turbulences dans les conduits
-
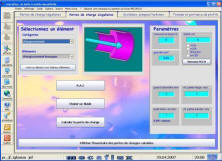
Perte de charge singulière. (flux internes) Les frottements et turbulences dans les reseaux de fluides aeraulique ou hydraulique
-
Dimensionnement de pompe ou turbine dans dans les reseaux de fluides aeraulique ou hydraulique. (flux internes) puissance d'une pompe ou d'une turbine
Les calculs de mécanique des fluides peuvent atteindre des degrés de complexité infinie, que nous évitons ici, en nous limitants aux applications concretes et pratiques.
L'objectif de ce site est d'initier en fournissant des logiciels et outils de réflexion ludique, rapides et appliqués à des projets concrets. En naviguant au grés des liens et de votre curiosité, vous développerez une connaissance de base sur la mécanique des fluides qui vous servira au quotidien pour la réalisation de vos projets.
En Soutien, un outil logiciel développé dans un esprit pédagogique de simplification, rassemble les outils de base pour traiter les projets en liens avec la mecanique des fluides. Ce site sert de support en ligne au logiciel mécanique fluides: Mecaflux standard
calculs de Portance et Traînée et calculs de pertes de charge
La liste des fonctions est détaillée sur la page: ![]()
Mecaflux standard est un logiciel développé dans un esprit pédagogique de simplification. Quelque soit votre niveau théorique, en quelques clicks, vous entrez vos données et vous anticipez les conséquences de vos choix techniques. économique en temps de paramétrage, aucun tracé nécessaire, et en prix 65 euros HT (78 ttc) (tarif au téléchargement).
le coup de pouce au bon moment dans vos calculs de pertes de charges, de pompes, d' aérodynamique , hydrodynamique et hydraulique. (Outil de conversion d'unités physique inclus).


Exemples d'applications de mécanique fluides:
Vous concevez un aileron de voiture, un foiler pour hydroptère, une aile d'avion modélisme, des bateaux, de la plomberie un système de pompage ou de turbine, une ventilation, une aspiration, un jet ski... ou c'est la curiosité qui vous guide...
-
Le calcul des pertes de charge de plomberie dans un système de pompage est un exemple de calculs de flux internes en mécanique fluide.
-
Les forces et frottements qui agissent sur les voiles, la coque ou la dérive d'un bateau relèvent de l'aérodynamique et de l'hydrodynamique. Elles sont évaluées dans les calculs de portance et de traînée de profils
 Index global
 Heliciel.com
 Table des matieres
 Aero/Hydro Dynamique
 Helices et turbines
 Methodes, theories, calculs
 Biblio. References
 Didacticiels Mecaflux Standard
 Didacticiels Pro3D
 Boutique
 Devis, Commandes, Moyens de paiements